U.S. equities were mixed on Friday but ended generally higher following a string of up and down days on Wall Street as investors pondered the route forward for interest rates and fresh sanctions against Russia. The Dow Jones Industrial Average finished the day 0.30 percent higher; the S&P 500 finished 0.44 percent higher, and the Nasdaq Composite finished the day -0.09 percent lower.
Source: DW
Even while negotiations between the two countries are still ongoing, Ukrainian troops continue to oppose. This situation undoubtedly causes commodity prices to rise more, particularly oil prices, which remain above $100 per barrel. High global oil costs cause worldwide inflation rates to rise further, weighing on the economic progress of every country on the planet.
The yield on 10-year US bonds has reached 2.4 percent, while the yield on 5-year bonds has reached 2.5 percent, indicating that market participants’ views on long-term uncertainty are beginning to emerge. The Inverted Yield Curve is an indicator of a coming economic recession, as market players are beginning to mistrust the long-term payment of government bonds due to the war in Ukraine, rising oil costs, and the Fed’s aggressive stance of raising interest rates this year.
Furthermore, the threat of a recession has prompted many investors to convert their financial instrument holdings into cash and cryptocurrencies such as bitcoin.
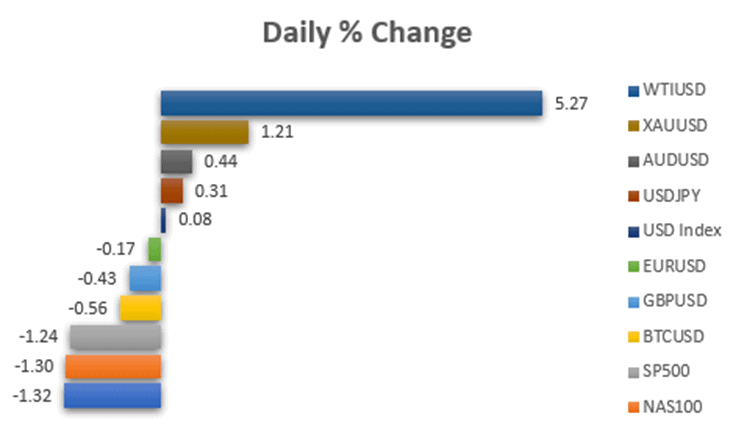
Main Pairs Movement
We can notice some market activity based on MT4 from VT Markets over the last week.
The US Dollar was up 8.44 percent, Bitcoin was up 7.97 percent, and Apple stock was up 6.28 percent.
Meanwhile, the USDJPY increased by 2.57 percent, and the XAUUSD increased by up to 1.85 percent.
The SP500 was up 1.72 percent and the NAS100 was up 2.31 percent on the US Index.
Technical Analysis
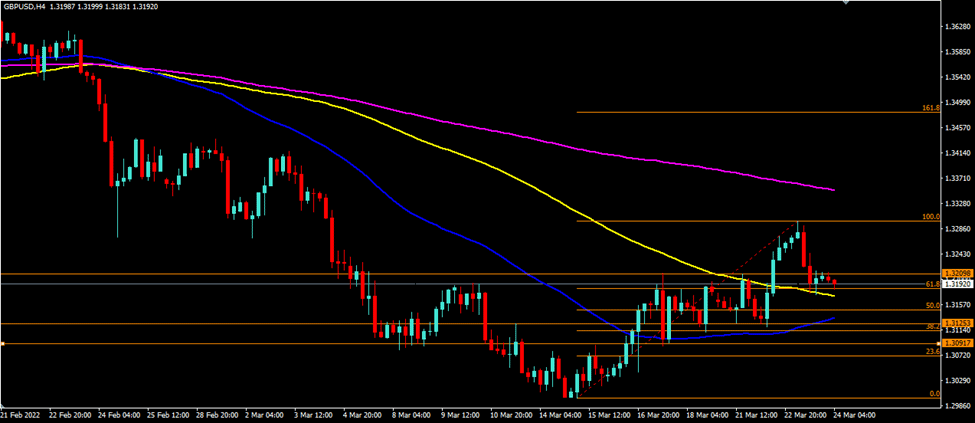
GBPUSD (4-Hour Chart)
The cable remains pretty solid; our resistance level of 1.3209 has not been broken, but upward momentum is weakening as we approach our next resistance area of 1.3269 – 1.3300. The cable is presently approaching our support areas of 1.3125 and 1.3150. On the four-hour chart, the cable is trading below its 50- and 200-day simple moving averages (SMAs), but above its 100-day SMA.
Resistance: 1.3209, area 1.3269 – 1.3300
Support: 1.3125-1.3150
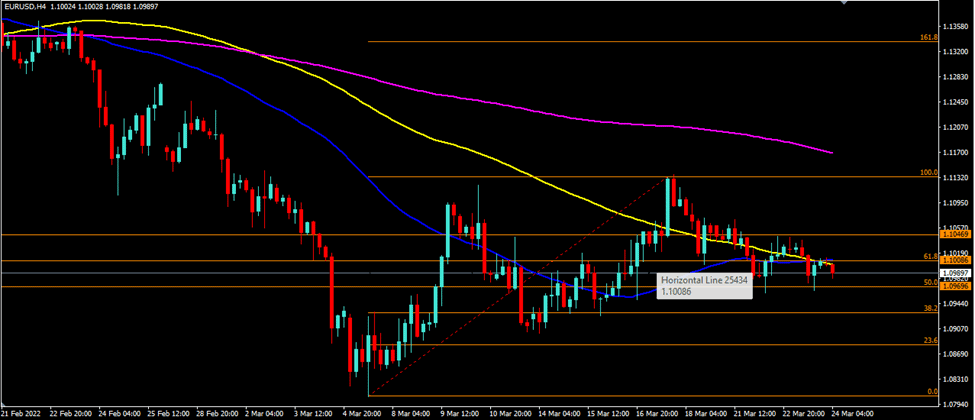
EURUSD (4-Hour Chart)
The EURUSD is unable to hold above our resistance level of 1.1008 and is falling back below it, breaking below 1.0969, which we can mark as our nearest resistance. The nearest support levels for the EURUSD are around 1.0925 and 1.0899. On the four-hour chart, EURUSD is currently trading below its 50-day, 100-day, and 200-day simple moving averages (SMAs).
Resistance: 1.0969, 1.1008
Support: 1.0925, 1.0899
XAUUSD (4-Hour Chart)
XAUUSD fell down below our 61.8 Fibonacci level of $1953 per ounce, as well as our resistance level of $1948 per ounce. For today, we can choose $1948 – $1953 per ounce as our nearest resistance level, with the next resistance levels at $1974 and $2000 per ounce. In the meantime, our support levels will be set at $1921 per ounce. On the four-hour chart, XAUUSD is now trading above its 50-day and 200-day SMAs but below its 100-day SMA.