Market Focus
U.S. equity markets rallied on the last trading day of January to close out one of the worst month of trading since March of 2020. The Dow Jones industrial average rose 1.17% to close at 35131.86, the S&P 500 gained 1.89% to close at 4515.55, and the Nasdaq composite leaped 3.41% to close at 14239.88. Gains were led by technology sector giants such as Tesla, Spotify, and Netflix, who saw share prices retreat significantly as the Fed continues inch towards rate hiking. The benchmark U.S. 10 year treasury yield slid to 1.784%, while the 30 year yield also fell slightly to 2.116%.

Tension between Ukraine and Russia continue to pose a threat over energy prices for the European zone, as major countries such as Germany, rely on Russia’s supply of oil and natural gas. Moscow has denied plans to invade Ukraine, however around 100,000 Russian troops have already gathered around the Ukrainian border.

Main Pairs Movement:
The DXY remained fairly unchanged over the course of yesterday’s trading and is at 96.648, as of writing. The Greenback lost some ground as treasury yields cooled off since reaching its peak last week.
The Euro traded lower against the Dollar over the course of yesterday’s trading. Eurozone GDP topped estimates, this helped the currency rally against the Dollar; furthermore, a continued accommodative ECB adds to the recent bullish outlook for the Euro.
The Sterling gained over the Greenback as the Dollar weakened across the board. Risk on sentiment could be attributed for the recent rally as global equities rebound from a turbulent trading week.
The Canadian Loonie lost 0.48% against the Greenback over the course of yesterday’s trading. The important Canadian Raw Materials Price Index saw a 2.9% drop, month over month.
Technical Analysis:

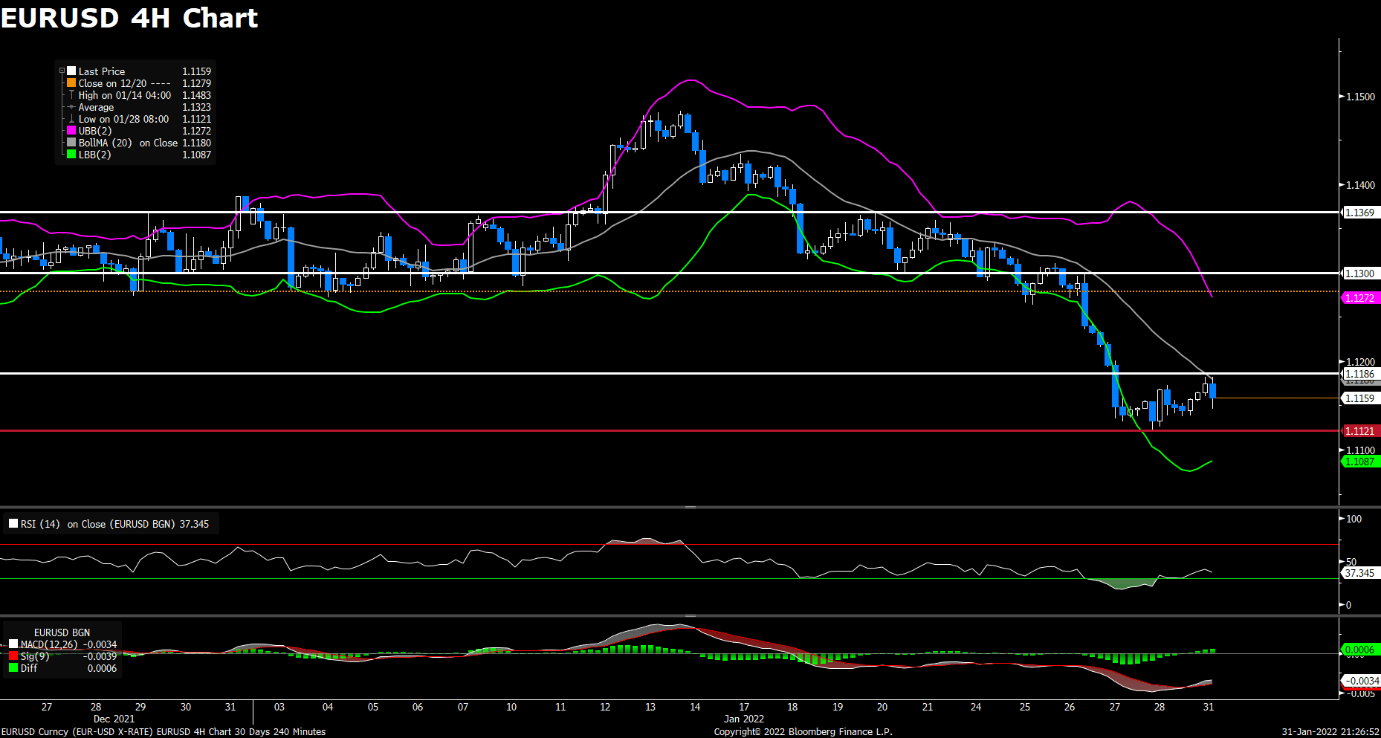
The EUR/USD pair advanced on Monday, extending its rebound from a yearly low that touched last week. The pair was trading higher during Asian session, preserving its bullish momentum and reached a daily high near 1.118 level in early European session. The pair was last seen trading at 1.1159, posting a 0.10% gain on a daily basis. EUR/USD stays in the positive territory amid weaker US dollar across the board, as the upbeat sentiment and reducing demand for safe havens dragged the US dollar index from the highest level since July 2020. In Europe, the Eurozone Prelim GDP met estimates with 0.3% QoQ in Q4 2021. On top of that, the dovish ECB might keep acting as a headwind for the shared currency.
For technical aspect, RSI indicator 36 figures as of writing, suggesting bear movement ahead. But looking at the Bollinger Bands, the price rose towards the moving average after touching the lower band, which indicates that the pair could remain its upside traction. In conclusion, we think market will be bullish as the pair is heading to test the 1.1186 resistance. A sustained strength beyond that level could trigger a short-term bounce and lift the pair back towards the 1.1300 area.
Resistance: 1.1186, 1.1300, 1.1369
Support: 1.1121

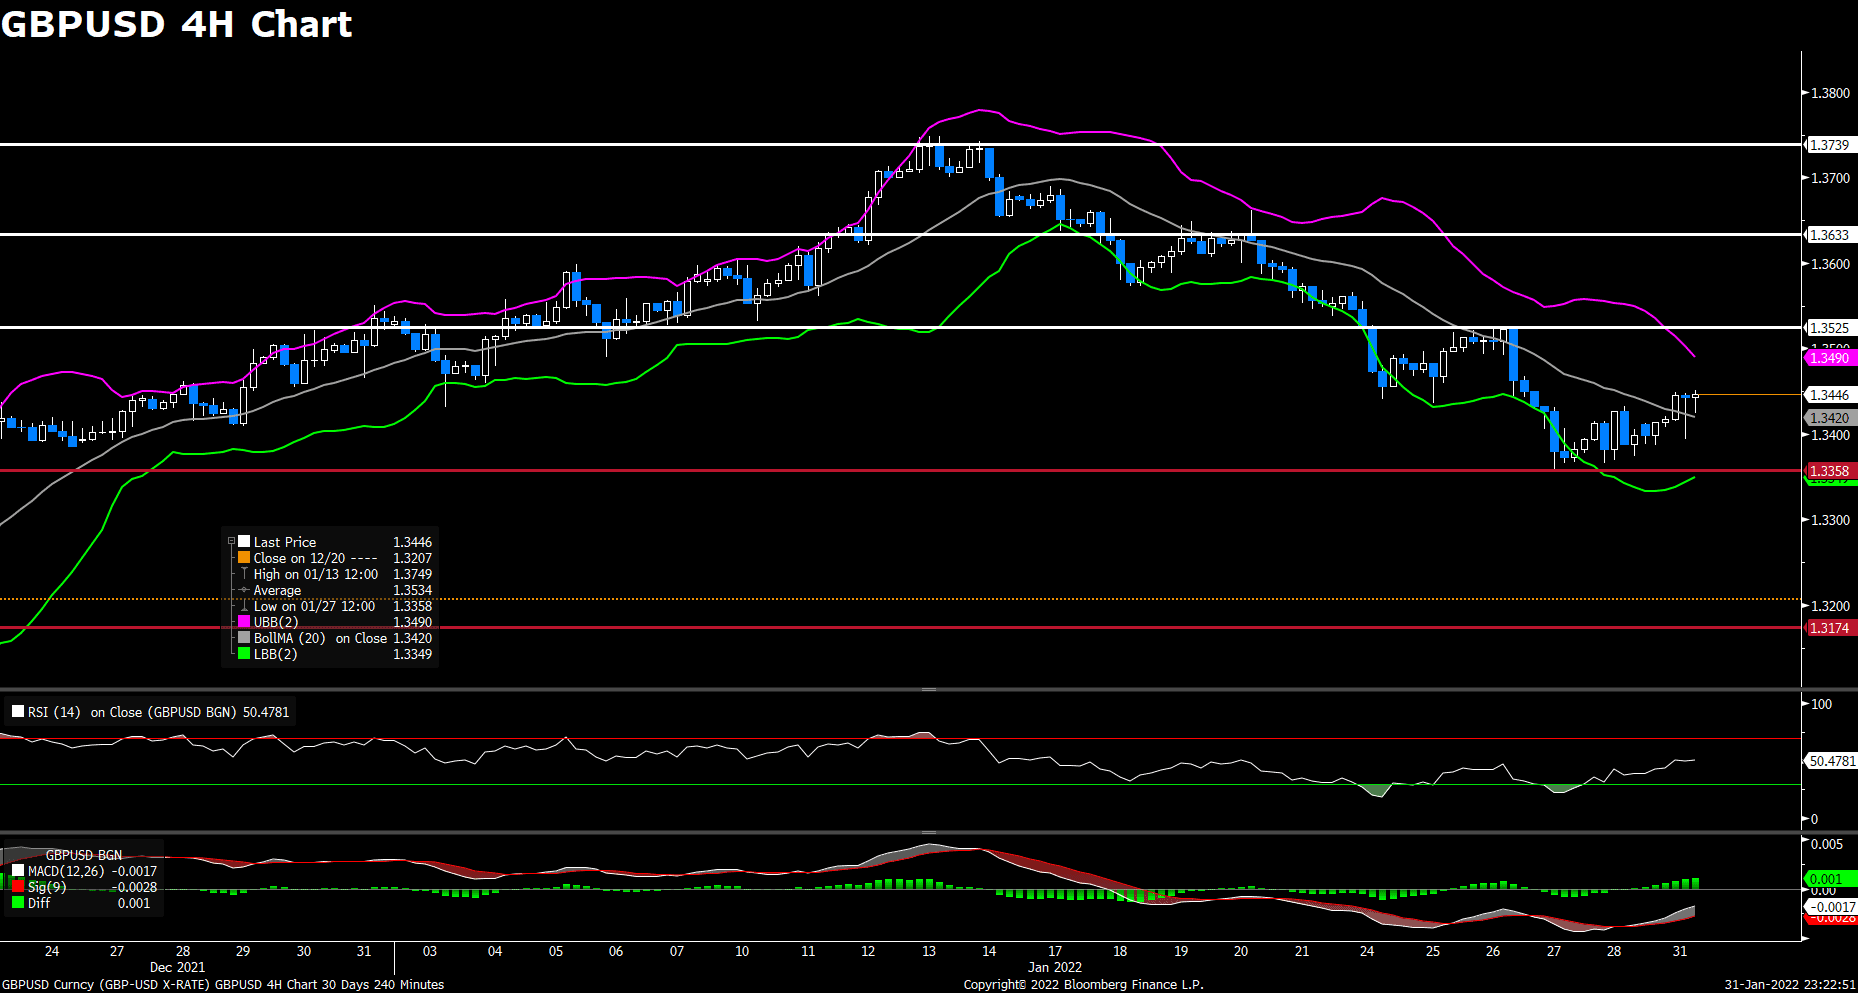
The pair GBP/USD advanced on Monday, recovering further from a one-month low below 1.337 level. The pair saw heavy selling and dropped to a daily low during European session, but then bounced back to 1.344 area heading into the America session. At the time of writing, the cable stays in positive territory with a 0.43% gain for the day, recovering most of its intraday’s losses. The bearish momentum witnessed in the US dollar is mainly due to risk-on market sentiment, as risk-sensitive currencies like GBP outperformed the safe-haven greenback. On top of that, expectations that the Bank of England will hike interest rates at Thursday’s meeting also underpinned British pound and acted as a tailwind for the GBP/USD pair.
For technical aspect, RSI indicator 51 figures as of writing, suggesting that buyers remain in control of the pair’s action in the near term. For the MACD indicator, a positive histogram shows that the pair might keep the upside traction. As for the Bollinger Bands, the price crossed above the moving average, therefore the upside momentum should persist. In conclusion, we think market will be bullish as long as the 1.3358 support line holds. A breach of the 1.3525 resistance would open the door for higher prices.
Resistance: 1.3525, 1.3633, 1.3739
Support: 1.3358, 1.3174
USDCAD (4- Hour Chart)

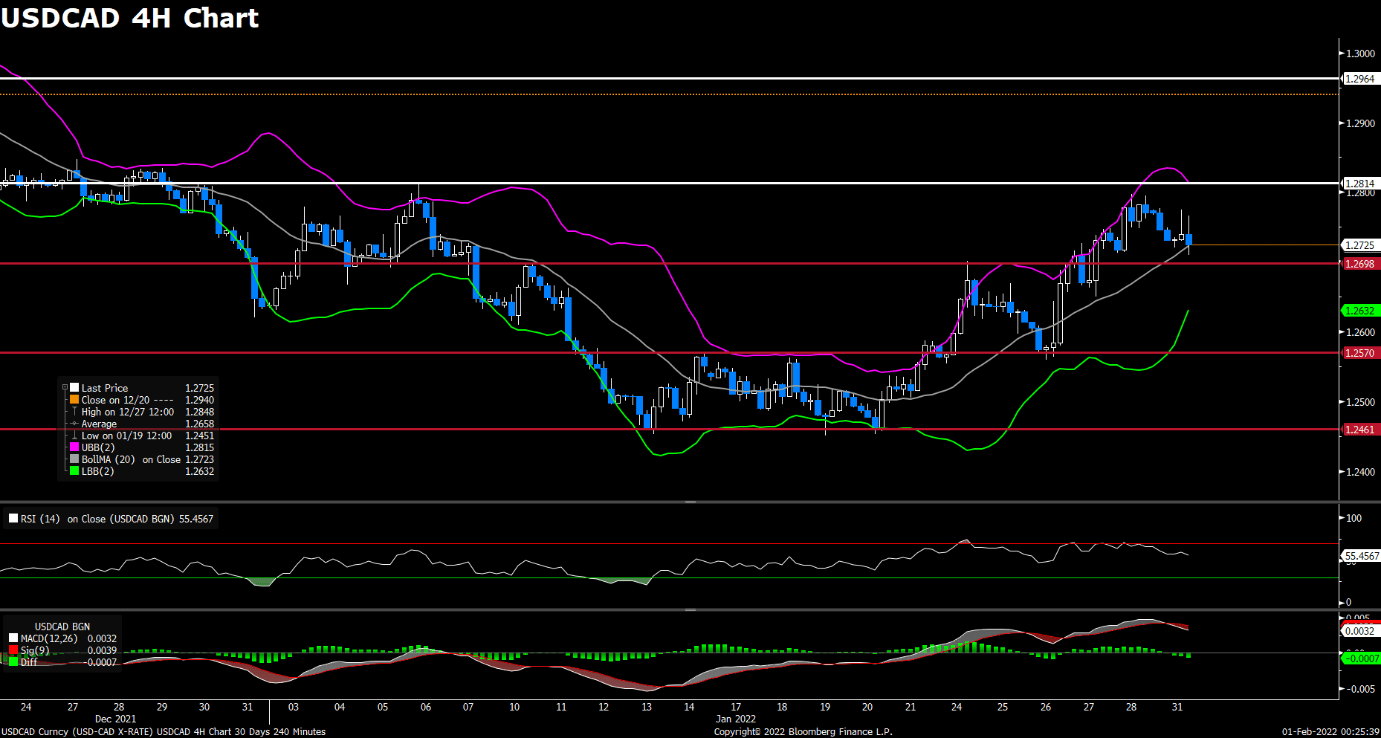
After last week’s rally to a three-week high near 1.280 level, the pair USD/CAD failed to preserve its upside traction and edged lower on Monday. The pair was surrounded by bearish momentum during Asian session, but then rebounded back above 1.277 area to recover some intraday’s losses. USD/CAD now continues to suffer losses amid renewed US dollar weakness, currently losing 0.36% on a daily basis. The falling US dollar has now sent the USD/CAD pair to a daily low, but BoC’s decision to leave the benchmark interest rate unchanged last week might undermined the Canadian dollar and limit the losses for the USD/CAD pair. On top of that, the rebound in crude oil prices has lent support to the commodity-linked loonie and dragged the pair lower, as WTI oil climbing 0.15% for the day.
For technical aspect, RSI indicator 55 figures as of writing, suggesting that the upside appears more favored as the RSI still above the midline. But looking at the MACD indicator, a negative histogram indicated downward trend for the pair. As for the Bollinger Bands, the price is dropping from the upper band to moving average, therefore the downside traction could persist. In conclusion, we think market will be bearish as the pair is eyeing a test of the 1.2698 support.
Resistance: 1.2814, 1.2964
Support: 1.2698, 1.2570, 1.2461
Economic Data:
|
Currency |
Data |
Time (GMT + 8) |
Forecast |
|
|
NZD |
Employment Change (QoQ) (Q4) |
05:45 |
0.3% |
|
|
EUR |
CPI (YoY) (Jan) |
18:00 |
4.4% |
|
|
USD |
ADP Nonfarm Employment Change (Jan) |
21:15 |
207K |
|
|
USD |
Crude Oil Inventories |
23:30 |
||