Daily Market Analysis
Market Focus
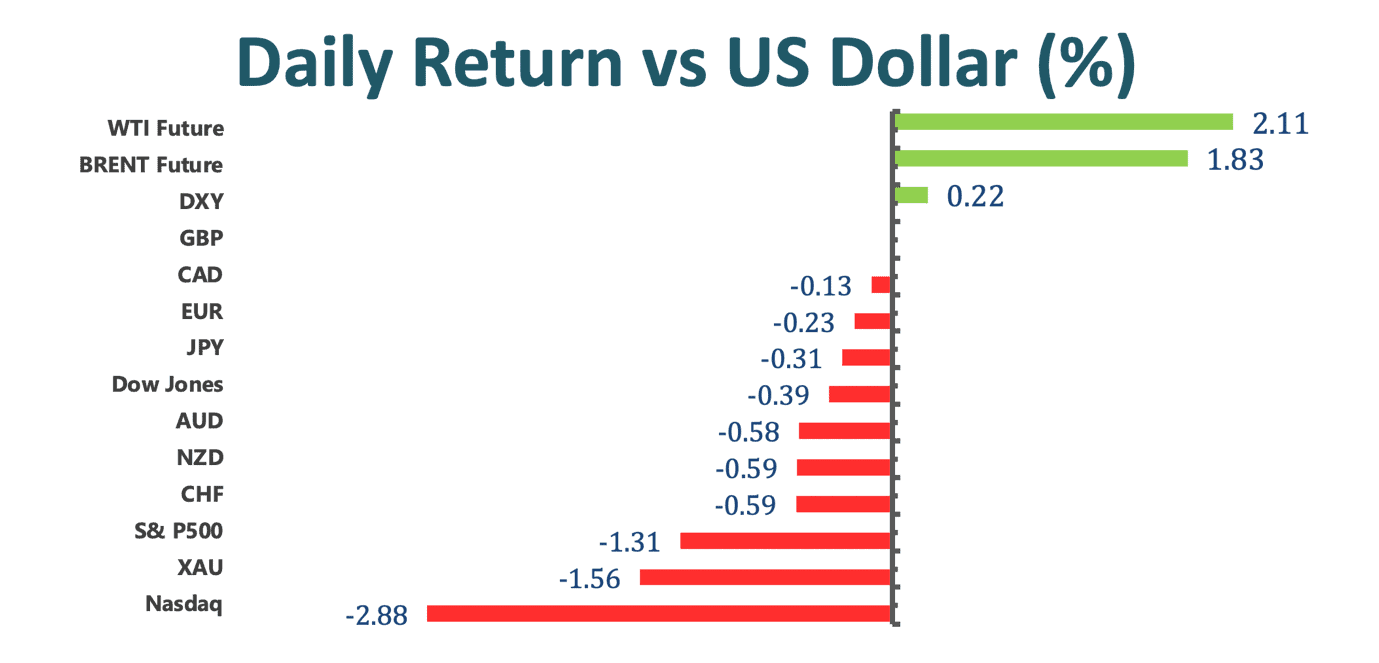
US markets declined as a surge in US Treasury yield, reaching as high as 1.4859% added to concern over stretched valuation amid an uneven economic rebound. The S&P 500 continued to loss for the second consecutive day as 10- year yields surged. The Nasdaq 100 was down about 2.5%. Additionally, weak economic readings on the US labor market and service, ADP Nonfarm Employment, also contributed the negative weight on equities markets. The Dow Jones Industrial Average was the only one that did not drop too much, led by the gain from Boeing Co. and JPMorgan.

In the US, lawmakers are heading to the final phase of enacting Joe Biden’s first pandemic- relief bill; at the same time, Joe Biden has rejected to trim extra unemployment benefits as the employment remains under water, near 2015 levels a year after coronavirus hit.

UK Finance Minister Rishi Sunak announced that UK corporation tax is going to 25% in 2023 as pandemic support has reached around 570 USD. Moreover, according to Sunak, UK won’t allow the debt to keep rising, so the UK is going to pay high attention to its affordability; at the same time, Sunak also announced the freezing of personal tax thresholds, removing incremental benefits created has thresholds continued to increase with inflation.
Market Wrap

Main Pairs Movement
Oil price jumped after the US reported that oil inventories showed a record drop in the aftermath of a deep freeze that shuttered refineries in the US South, especially Texas. Crude futures rose as much as 3.5% today, the largest intraday gain in a week. Moreover, oil price has surged more than 25% so far this year as the OPEC+ continued its production curbs and expectations for demand to rebound as vaccines are rolling out worldwide.

Benchmark 10- year Treasury yields climbed as much as 6.8%, highest rate since last Thursday’s startling selloff in government debt. In the meanwhile, the anticipated annual inflation rate for the next half- decade has exceeded 2.5% for the first time since 2008, along with surging crude oil prices. The high inflation anticipation also came from Joe Biden’s pandemic relief package, which is likely to get passed soon. Rising yields have started to draw the attention of Feral Reserve, leaving all eyes on Thursday’s Jerome Powell’s speech.

Cable extended gain after UK Rishi Sunak announced a new budget, taxations, and other measures to support the economy. Money markets are now pricing in 10bps of interest rate increases from the Bank of England by the end of 2022. The hawkish repricing of market expectations for the BOE policy seemed to offer some support for Cable.
Technical Analysis:
GBPUSD (Four- Hour Chart)

GBPUSD has rallied a little today but gave back the gains just above the 1.40 level to continue showing the hesitation to penetrate the psychological resistance at 1.4000. The major resistance sits at the 1.4180, a barrier that has been important more than once. On the four- hour chart, the pair remains bullish as it stays in the ascending trend and the 100 SMA; in the meantime, the bullish momentum is supported by the MACD as the MACD line is above the signal line. If and when GBPUSD can successfully break above the 1.40 level, it will open the way to continue the overall uptrend and drive the market towards the 1.4180 resistance in general. To the downside, if GBPUSD breaks below the current support at 1.3851, then it will open a chance to test the three- month support at 1.3748, potentially turning the near- term trend into a bearish mode.
Resistance: 1.4000, 1.4180
Support: 1.3851, 1.3748
USDJPY (Daily Chart)

The US dollar continues to extend north against the Japanese yen amid the rising Treasury yields. In the near- term, USDJPY is likely to confront a pullback as the RSI indicator has reached the overbought situation and the pair has reached the upper band of Bollinger Band. If not, the next retreat level is expected to see at the level of 107.7, which is the next resistance. In the bigger picture, USDJPY is still staying in long term descending channel that started back in 2016.
Resistance: 107.7, 109.24, 111.14
Support: 106.16, 104.26, 101.19
EURUSD (Daily Chart)

EURUSD remains neutral on the daily chart, trading in the 1.2050 price zone; at the same time, the RSI indicator is also in the neutral position, currently at 45. On the upside, a break from 1.2349 will open a path to extend its bullish momentum as breaking upward the ascending channel. To the downside, if EURUSD penetrates its current support at 1.1978, then it will likely to head toward the next immediate support at 1.1748.
Resistance: 1.2349
Support: 1.1978, 1.1748, 1.1562
Economic Data
|
Currency |
Data |
Time (TP) |
Forecast |
||||
|
NZD |
RBNZ Gov Orr Speaks |
04:15 |
N/A |
||||
|
AUD |
Retail Sales (MoM) (Jan) |
08:30 |
51.0 |
||||
|
GBP |
Construction PMI (Feb) |
17:30 |
51.0 |
||||
|
USD |
Initial Jobless Claims |
21:30 |
750k |
||||